 Road warriors are a hardy bunch. tClara’s data on more than 100,000 travelers shows that each month road warriors often spend more than ten nights away from home, and spend more than 30 hours on planes. Month after month, that adds up to a lot of wear and tear.
Most road warriors can handle it – for a while. But sooner or later, all that travel-related wear and tear (aka traveler friction) builds up, and then the traveler burns out.
Burning out a road warrior is incredibly expensive, especially if the traveler is on the road producing revenue or serving high-value customers. So it makes sense to look hard at what causes traveler friction, how it impacts a business, and what should done about it.
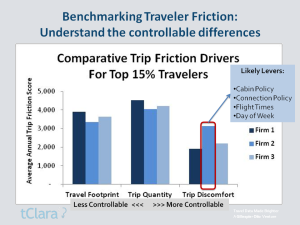
Benchmarking Traveler Friction’s 3 Key Drivers
It’s a simple equation:
Traveler Friction = Trip Quantity x (Travel Footprint + Trip Discomfort)
tClara has applied its patent-pending Trip Friction™ algorithm to over 500,000 trips from 100,000 travelers around the globe. This means that firms can now objectively understand what their travelers are experiencing.
 Trip Quantity captures the raw amount of travel a person does. It’s a combination of the number of trips taken, and the duration of those trips. Some road warriors make a lot of short trips, while others make fewer but longer trips. There is a friction factor for planning a trip, and another for how long the trip lasts.
Trip Quantity is somewhat controllable. It might best be viewed as a demand management opportunity…is your firm traveling much more, or much less, than your competition?
The Travel Footprint factor reflects where the traveler goes. Is it a day trip between Washington and New York, or a three-continent trip to five major cities across 20 time zones? A company’s travel footprint is not very controllable, so it should be viewed as a normalizing factor when looking at overall traveler friction scores across firms.
The Trip Discomfort factor measures things like what types of countries are on the itinerary (from a risk perspective), the cabin the traveler flies in, what part of the day or night they travel, whether or not they travel on a weekend, etc. These things matter to travelers. They affect productivity, health and safety, and over the long run they impact the traveler’s work-life balance.
The Trip Discomfort factor is the most controllable of the three benchmarks, and should be a focus for any firm looking to reduce its traveler friction levels.
The good news is that traveler friction can be measured using basic data from a company’s travel agency. This data shows how companies compare on overall traveler friction benchmarks, and how they compare on the more controllable factors, such as cabin policy, weekend travel, and early morning or late night travel.
 I envision firms using these benchmarks as part of their recruiting pitch to candidates for high-travel jobs. It makes for a fact-based way to set realistic expectations…and possibly gain a recruiting advantage.
But does traveler friction really matter to the business? I’ll cover that in the next post.
Up next: The Business Impact of Traveler Friction
Want articles like these delivered to you by e-mail? Sign up here. It’s free, and you can unsubscribe at any time.